Cultural Data Project Part 1
Introduction
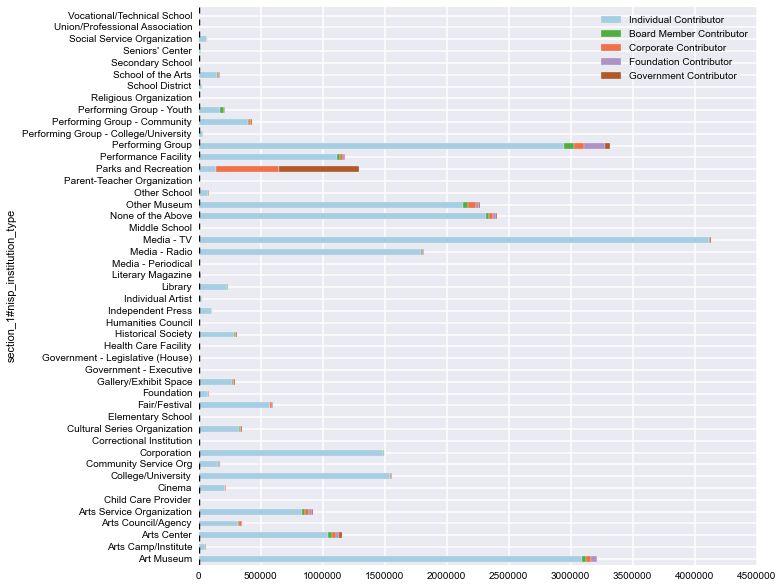
Data is from Cultural Data Project. In order to get a better understanding, I seggregated the data by organization type. There are total 48 different organization types. Data follows data profile structure and I grouped organizations into 6 different subsections; employment statistics, their activities, pricing, website activity, attendance and finally number of contributors. Before looking at the distribution of the above metrics, let’s look at when organizations are founded. The first cultural organization dates go back to 1636 according to data and youngest one seems to be 2012.
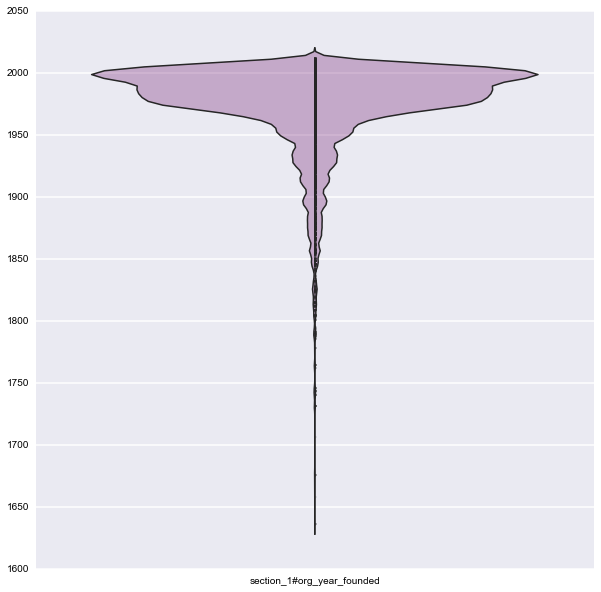
Mean year is approximately 1975 and median year is 1984. The width of the plot shows the number of organizations that are founded in a year shown in the y axis. Most of the organizations are founded between 1950 and 2000 where around 2000, it reaches its peak. This could also be observed from the difference in median and mean year.
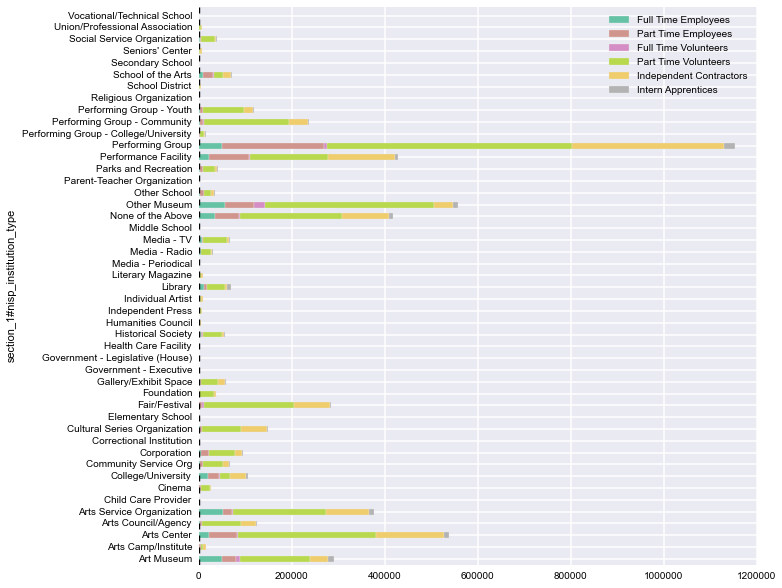
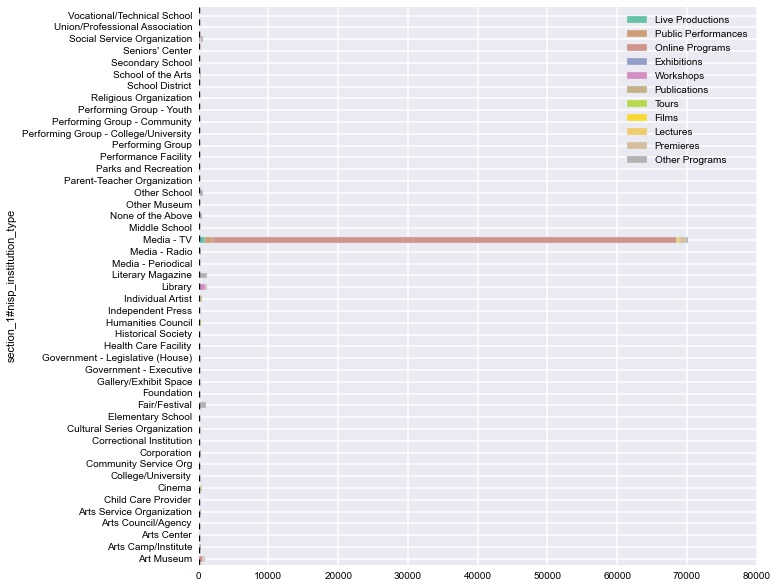
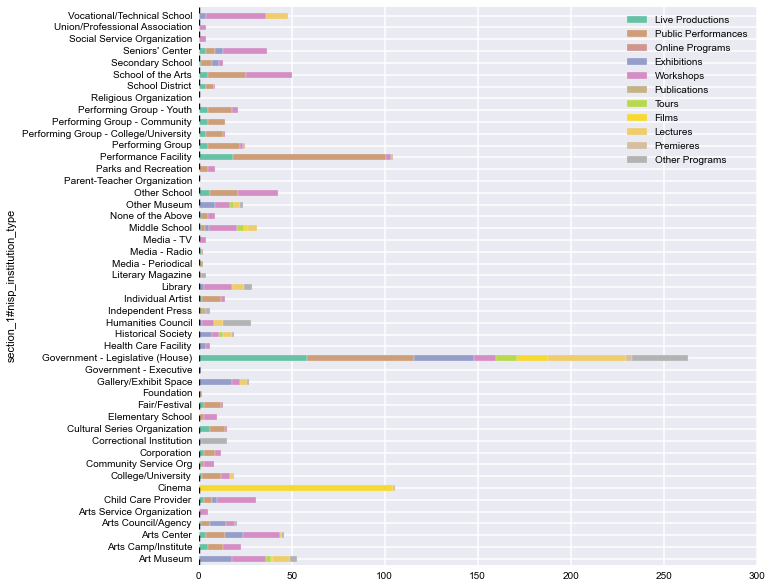
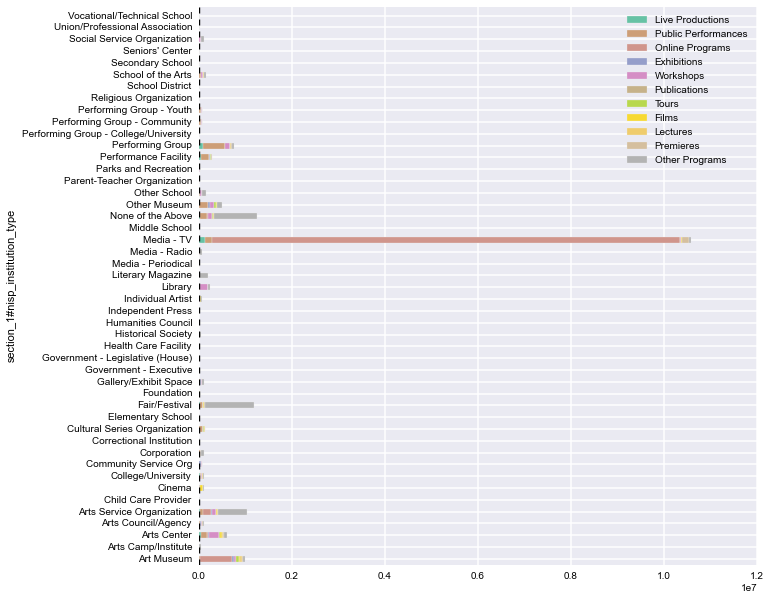
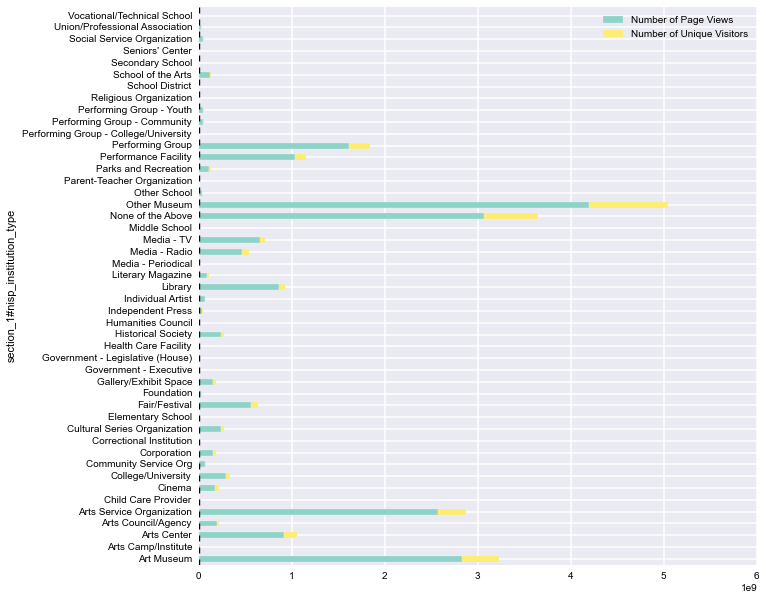
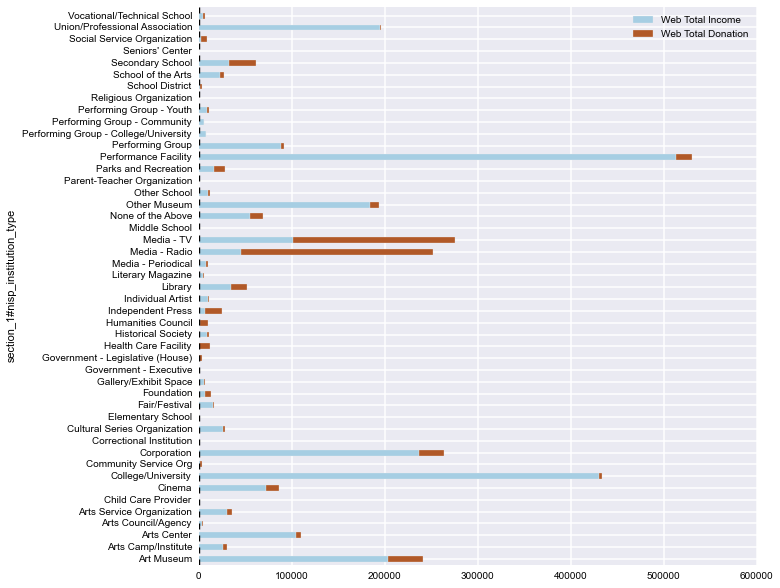
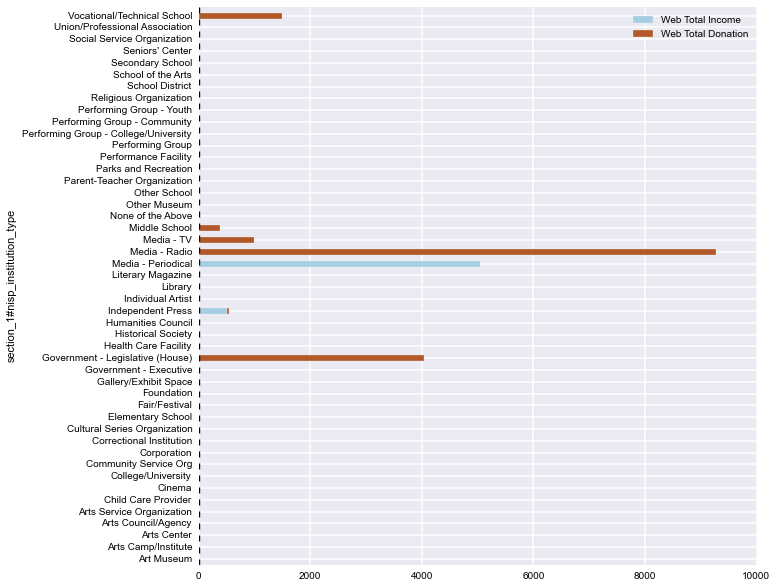
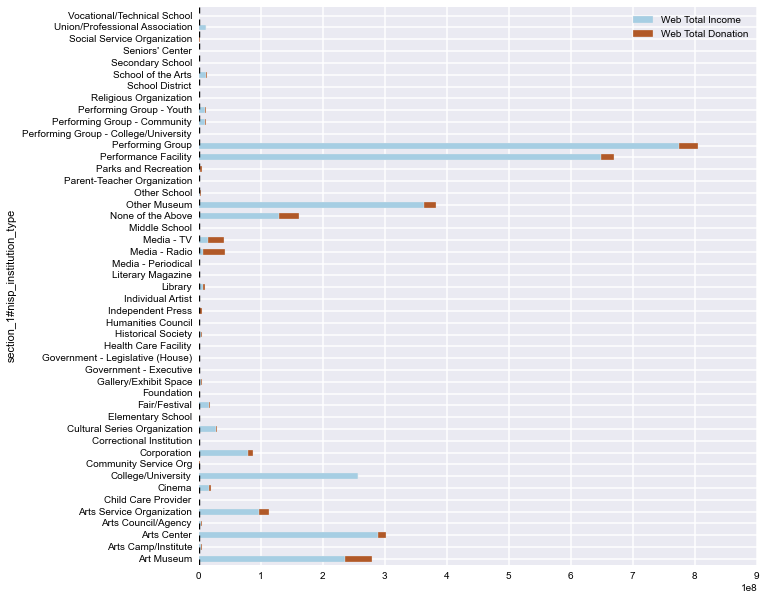
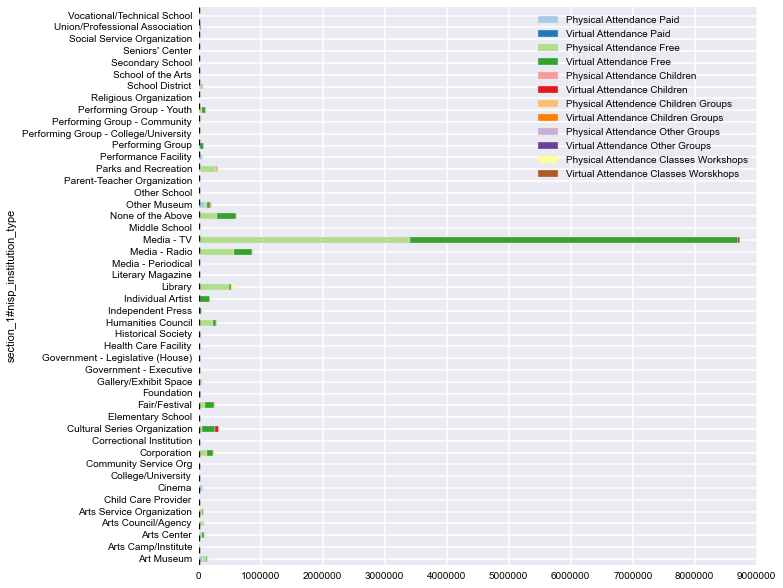
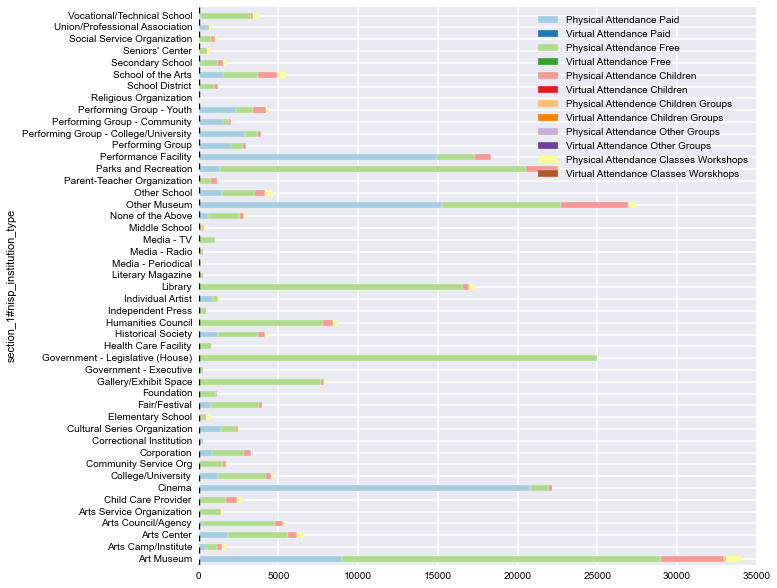
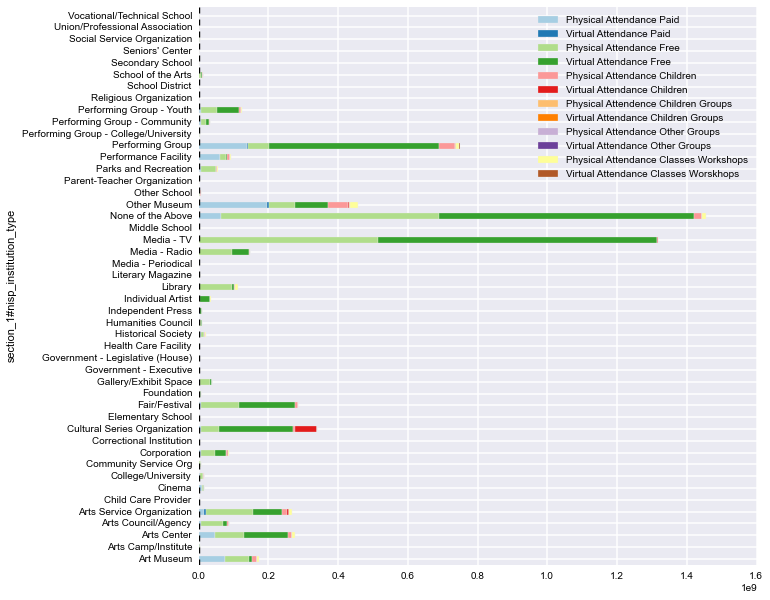
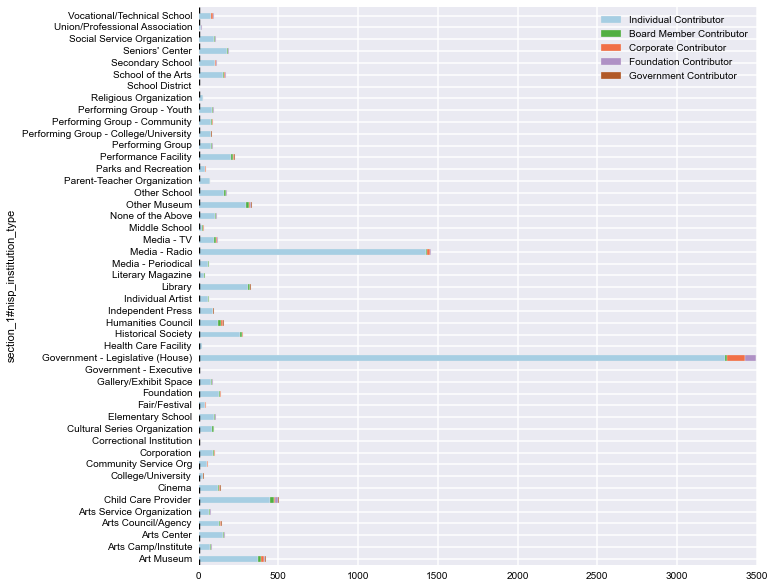
Unless, it is stated otherwise, every subsection will give the mean, median and sum statistics of the variables. The reason why three graphs are provided is because some of the organizations are quite large in terms of revenue, human resources and other metrics. As you will see later, these companies’ metrics dominate other companies; sum and mean of those sections mostly reflect their statistics ignoring other organizations. Median provides a nice solution for this type of statistics as it is a metric which is quite robust to outliers. Mean and sum statistics are provided as they are also very useful to summarize the data when there are not outliers or small number of outliers.
Organization types are sorted by alphabetical order so the None of the Above should change None of anything else.
Employment
Mean
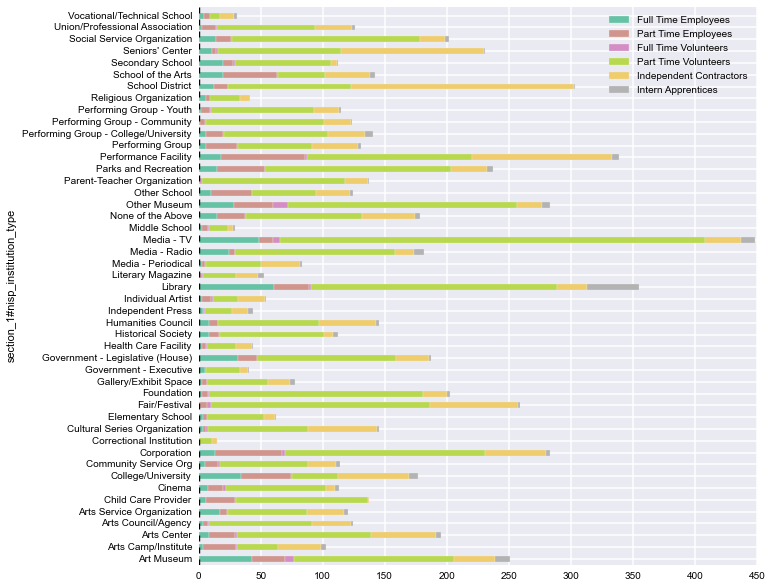
Median
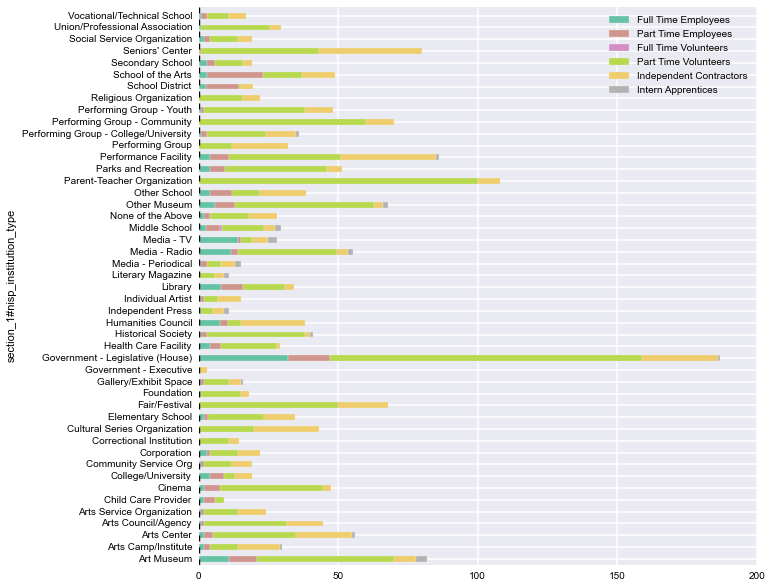
Sum
Activity
Mean
Median
Sum
Pricing
Mean

Median
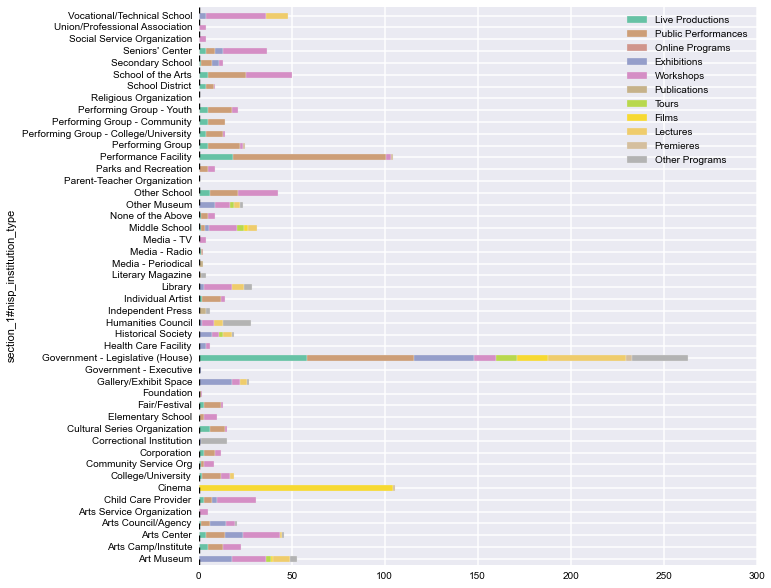
Sum
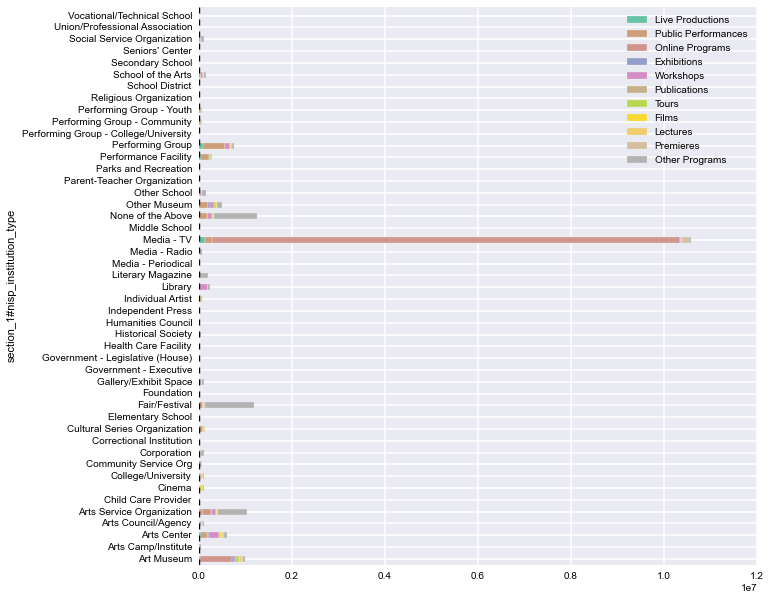
Web Activity
Mean
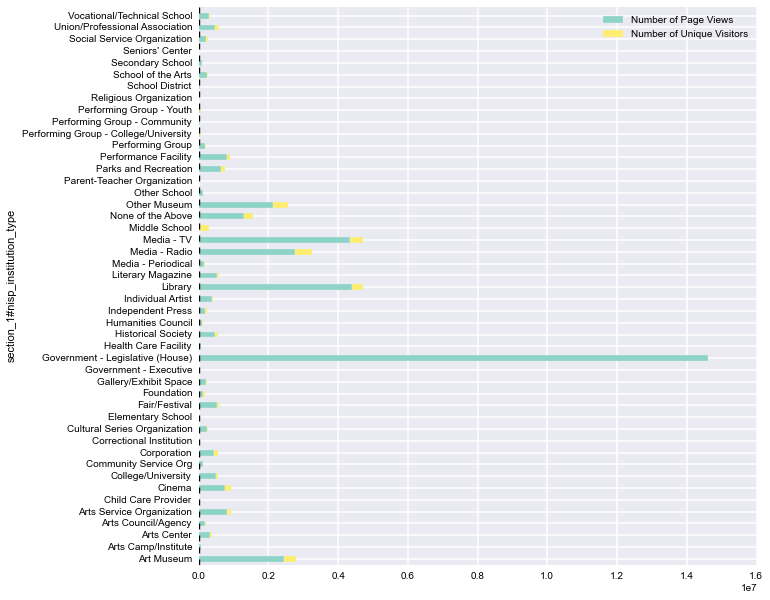
Median
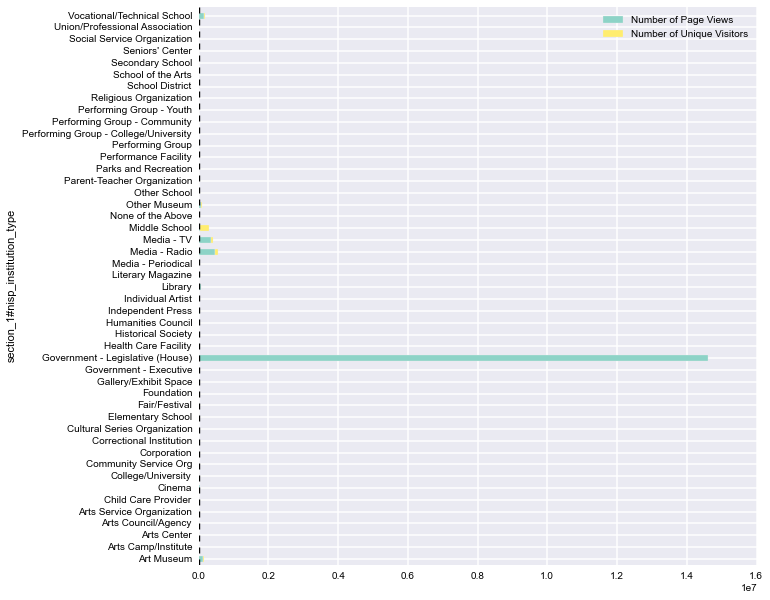
Sum
Web Income
Mean
Median
Sum
Attendance
Mean
Median
Sum
Number of Contributors
Mean
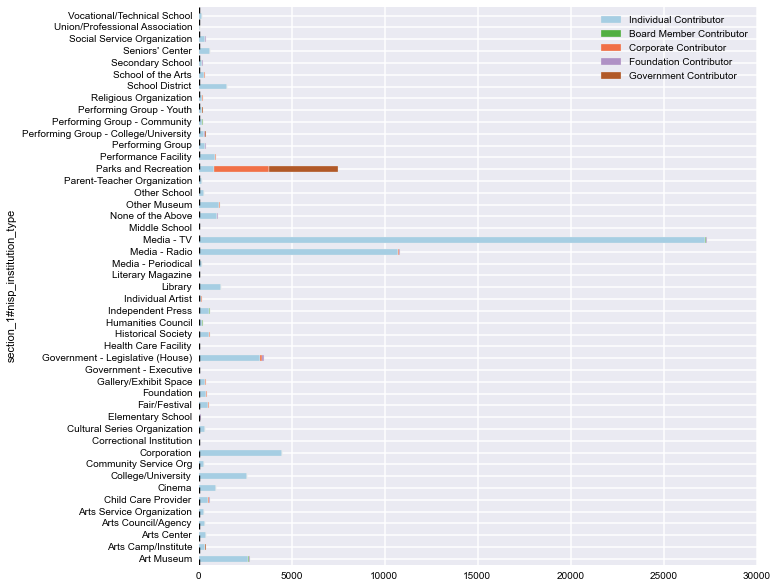
Median
Sum
